

Key Insights:
- Mog coin daily chart broke a descending trendline and now is forming a double bottom, signaling a potential reverse point.
- Massive leveraged liquidity resting above and below the current price levels.
The memecoin market saw a blow after the run towards the end of 2024, and the Mog coin was no exception. The coin showed potential for a reversal only that the markets were highly bearish, challenging this move.
Mog Coin Price Action and Prediction
The daily chart of MOG generated a potential reversal pattern that broke through a downward-sloping trendline. However, Mog coin could continue its downtrend if it does not sustain support at $0.0000003380. This would signal a bearish continuation phase.
The coin also showed negative momentum, with the MACD line at -0.0000000504 and the signal line at -0.0000000488. It was associated with a worse histogram position.
On a positive note, MOG maintained its position within the essential support level at $0.0000003380. A reversal might form there.
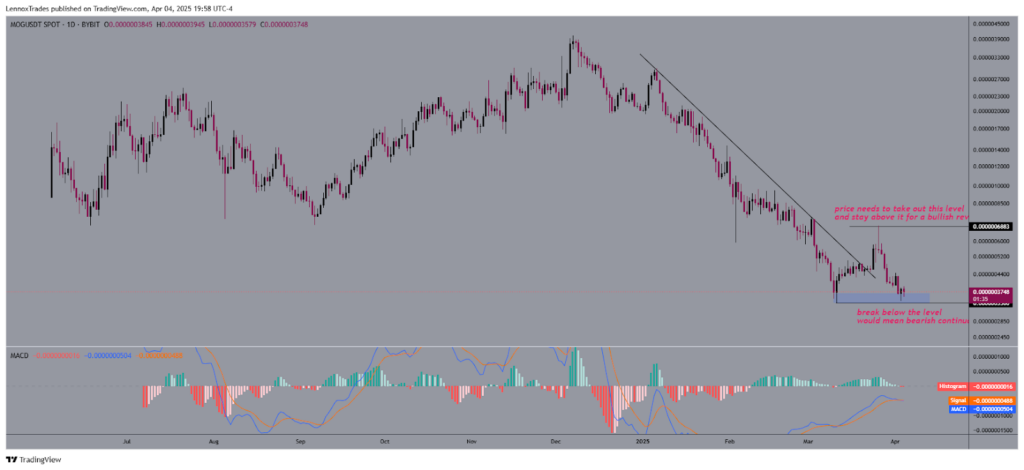
The double bottom pattern indicated potential momentum shifts. Price stability above support could trigger a bullish trend reversal.
A break with a sustained stay above $0.0000006883 would confirm the possible uptrend. This would help buyers take charge of the market.
For an upward potential to strengthen, MACD needed to cross above the signal. The descending trendline break was an early sign of changing momentum. However, a flip $0.0000006883 was the key.
If buyers protect the $0.0000003380 level of support, a move up could be anticipated. Meanwhile, a further decline in Mog coin price could likely continue if the support was broken.
Liquidation Heatmap
According to the Binance MOG/USDT liquidation heatmap, substantial leveraged liquidity existed in higher and lower price ranges of $0.0000003739. An 18.98K level of liquidation leverage existed above this market value at $0.0000003994.
The price range from $0.00000040 to $0.00000044 contained various short-liquidation zones. This displayed increasing intensity.
A price increase could compel short sellers to close their positions at these levels. This action may trigger buy orders, driving upward momentum for Mog coin.
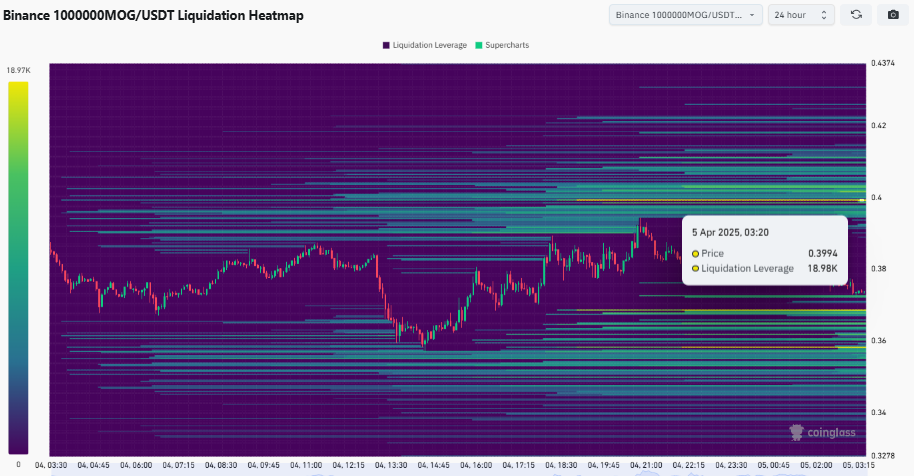
The $0.00000036 and $0.00000037 levels acted as majors for liquidating long positions if Mog coin price dropped. Pressures from selling activities can potentially quicken the decline.
Since market makers execute their orders primarily in these high-liquidity regions, MOG prices tend to shift towards those zones.
Analysis of Mog Coin
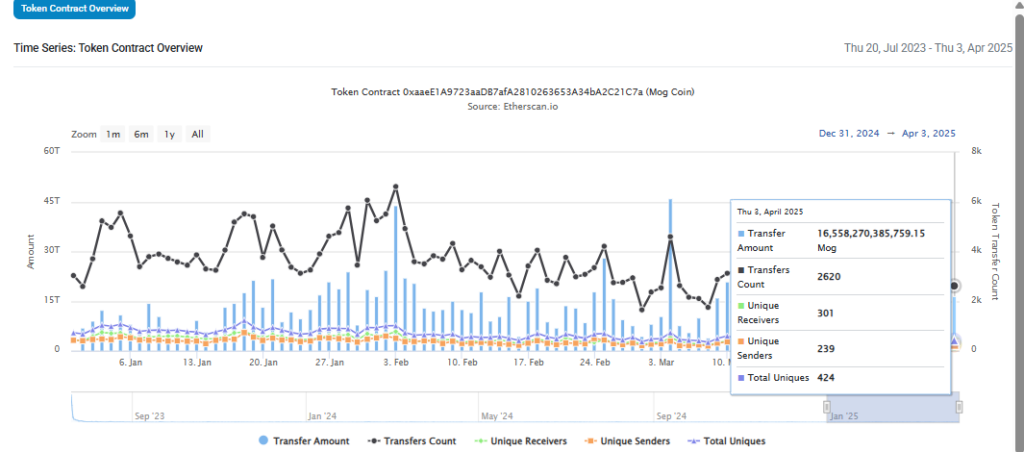
This April saw about 16.56 Trillion MOG being transferred with 2620 counts of transfers. This was across 301 unique receivers and 239 unique senders for a total of 424 uniques in a day.
For example, transfer volume ballooned during the first weeks of February and March 2025. That implied some form of spike in the transaction intensity might be short-term in nature.
The analysis highlighted Mog Coin’s on-chain activity, emphasizing larger transfer sizes and volumes. This suggested increased utility and higher trading demand, potentially driving positive price trends forward.
Steady activity in these assets could showcase resilience during a significant market correction. This reflects underlying demand or strong community support.
In contrast, a shocking decrease in transfer activity and visible participants may be interpreted as declining interest. This could boost price drops in case of continued market declines.
The chart showed periods of tremendous and minimal use. Also, the effects on the price of Mog Coin would most likely vary as in the past. More regular monitoring of those metrics in the medium term could be used to inform future pricing and token health.