

Key Insights:
- Litecoin’s price may dip to $72–73 before the breakout.
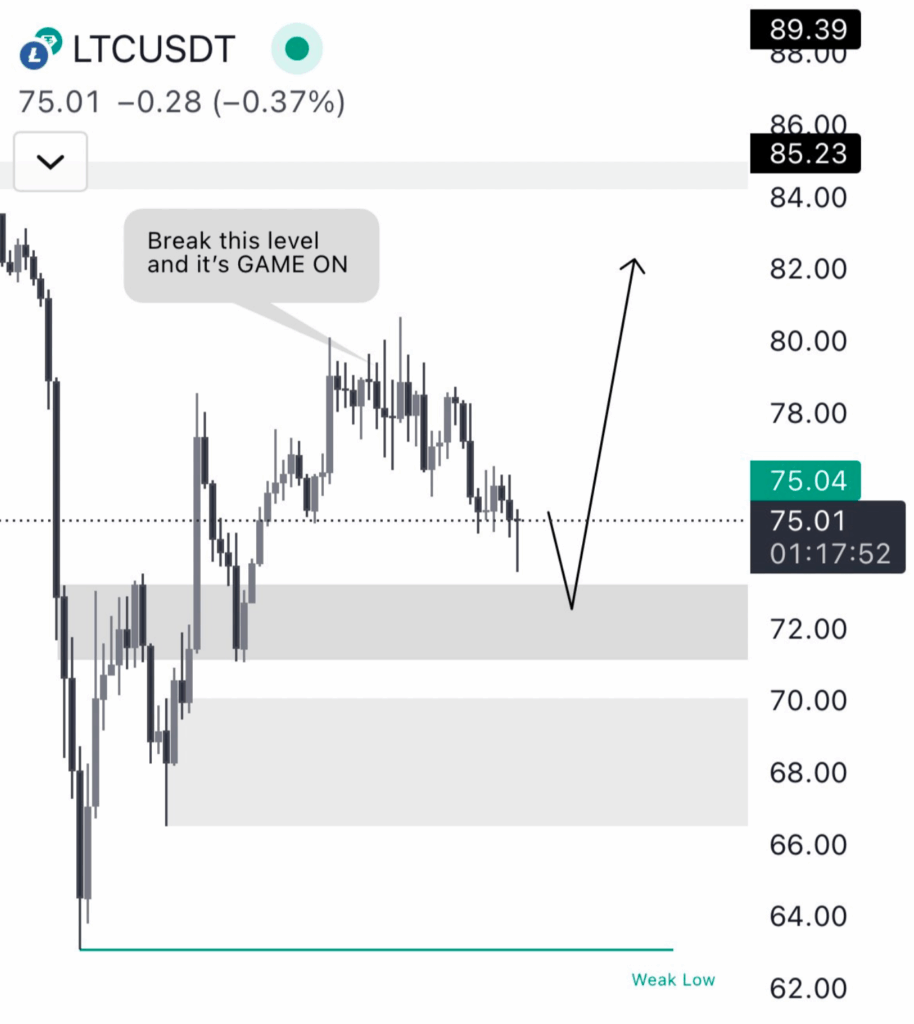
- A break above $86 could signal a strong upward move.
- Liquidity at $72–73 is key for Litecoin’s following price action.
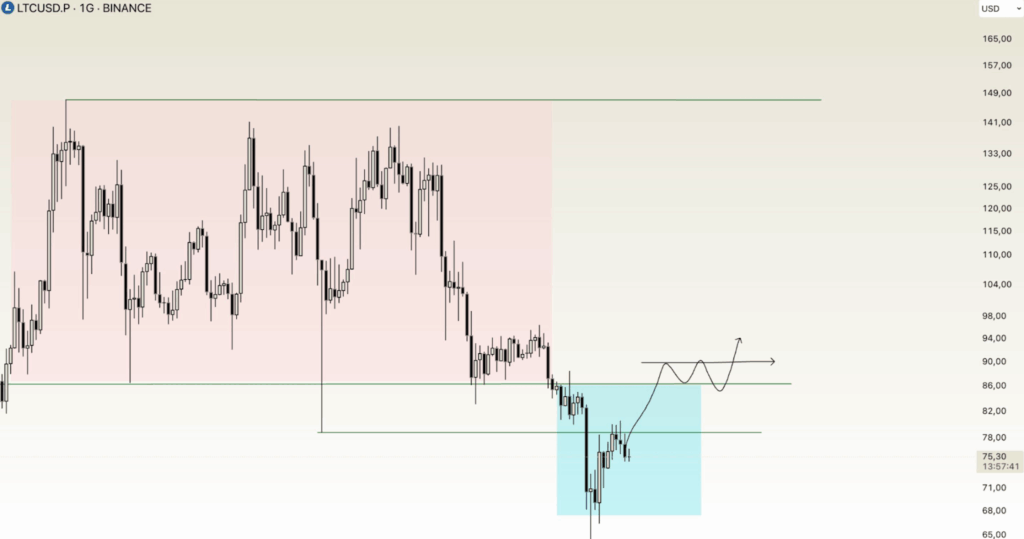
Litecoin ($LTC) is coming to a critical juncture in its price action. The Latest analysis suggested that LTC price will sweep liquidity up to the $72–73 range and start actual price action.
Because this final dip is to grab the liquidity, it could lead to a massive upward movement if the demand zone holds.
Litecoin’s behavior at this level is what traders and investors are eagerly awaiting. If LTC price breaks out here, another bullish wave is on the cards. Otherwise, consolidation would continue.
LTC Price Action and Liquidity Sweep in the $72–73 Zone
LTC price should resume its upward trend after breaching the demand zone between $72 and 73. This sweep will take in the remaining market liquidity and put sufficient buying pressure against the trend reversal.
In the first picture, the price action remained slightly above the $75 level. It appeared poised to dip into the lower demand zone, anticipating a breakout.
It’s not a weakness. But in this case, it is a part of the natural price movement in the marketplace. Market makers will sweep the demand zones to fill sufficient orders before a significant upward move begins.
After that sweep, the market will likely stop and retrace direction, at least testing at higher resistance levels. The $72–73 range serves as a critical level for LTC price. Its recovery from this zone is expected to determine the short-term market direction.
The Case for a Bullish Move Following the Liquidity Grab
According to the charts, capturing liquidity in the $72–73 zone could pave the way for Litecoin’s next significant resistance. This resistance is identified around the $85–86 level, hinting at potential bullish momentum.
A considerable upward momentum can be anticipated if Litecoin breaches this resistance. Getting a clean break above $85–86 might mean a new trend in play could hit even higher resistance levels. This could include $89.39 and finally the psychological $100.
Any sustained upward movement depends on breaking the $86 resistance. A significant market sentiment shift will occur if the price breaks above this level.
This could pave the way for further bullish price action. $86 is a key resistance zone. It looks like Litecoin is ready to break out and clear this level. Also, if the other cryptocurrencies show strength, they should see higher areas of demand.
However, until this level is broken, Litecoin’s price action is expected to move between $72 and $86. Traders and speculators benefit because they have the structured environment to watch for key breakouts in this range-bound movement.
If volume is enough, LTC price has a good chance of breaking clean through that $86. Failure to do so, however, may lead to a period of consolidation below $86 for a very long time.
At press time LTC price was trading at $75.19, increasing 0.22% in the last 24 hours. The market cap of $LTC was $5.68 billion, with a 24h trading volume of $383.91 million.
A 15.53% increase in trading volume over the last day indicated that Litecoin’s trading volume has surged. Lately, fluctuations have revealed that Litecoin is consolidating from a price range of $72 – $75.
The recent price action is setting up the next big move in Litecoin. As per the chart, Litecoin has tested a crucial support level above $75, which also acted as a demand to hold up.