

Key Insights:
- XLM hovered near $0.23490, testing a descending wedge resistance, hinting at a potential breakout above $0.23850.
- XLM whale stablecoin holdings rose to 51.79%, indicating renewed confidence and possible accumulation before further price movement.
- Stellar could benefit if market fear eases, as historical trends link low Fear & Greed Index readings with BTC rallies.
The 1-hour XLM/USDT chart revealed a descending wedge pattern with trendlines showing lower highs and lower lows. This pattern, crucial for XLM price prediction, narrowed the price range from $0.24869 to $0.22800.
This pattern traditionally suggested a potential bullish reversal. Also, the recent Stellar price action has respected the wedge structure multiple times.
When writing, the price hovered around $0.23490, testing the upper resistance trendline. Fibonacci retracement levels marked critical inflection points, ranging from the swing high of $0.24869 to the swing low of $0.23201.
These levels are instrumental for analyzing the market movements’ potential support and resistance areas. The price had recently bounced around the 78.6% level at $0.23573.
This indicated an XLM price prediction that it might attempt a move toward the 61.8% retracement level at $0.23850. A successful breach of this level signaled a continuation toward $0.24044 and $0.24480.
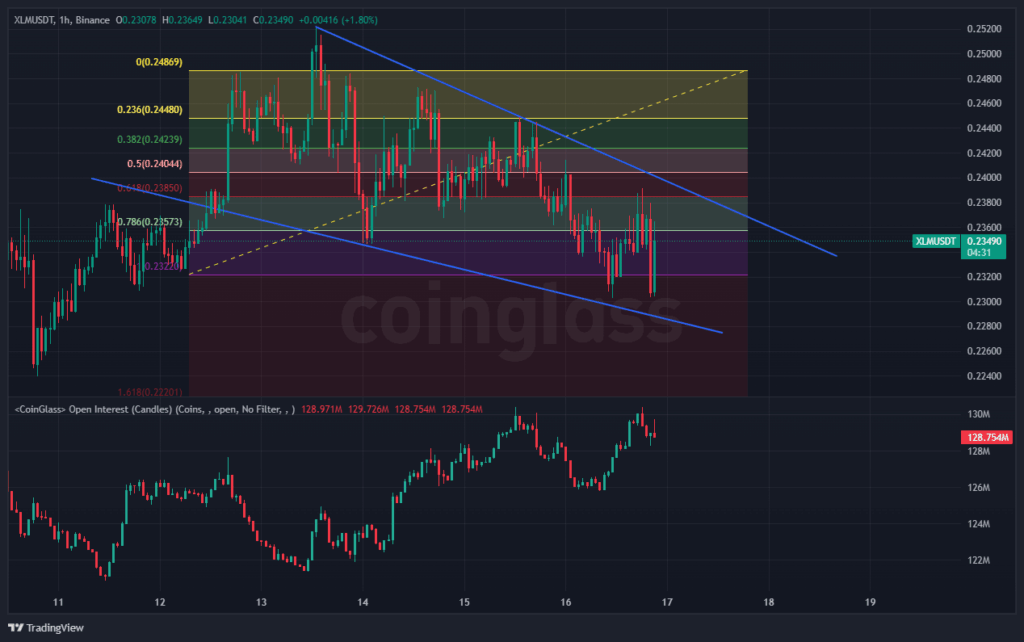
Failure to reclaim the $0.23573 level could result in a decline toward $0.23201. Persistent bearish pressure might push the price even lower. The 1.618 Fibonacci extension at $0.22201 could become the next downside target.
Open Interest candles indicated a slight decline from a peak of 129.726M to 128.754M. This reflected minor cooling in leveraged activity, which might suggest reduced speculative momentum in the short term.
If Open Interest rises again as the price nears resistance zones, it could signal strength in the market. This might validate a breakout above $0.24044.
Conversely, a simultaneous drop in price and Open Interest might confirm that bearish sentiment was taking control. Overall, the descending wedge pattern hinted that XLM price prediction might favor a breakout above $0.23850.
These indicators collectively suggested a strong potential for upward momentum in the market. However, a breakdown below $0.23201 would risk invalidating the setup and might drag the pair toward $0.22201.
XLM Price Prediction: Stablecoin Holdings Point to Strengthening Confidence
Moreover, the total supply held by whales, which was over $5 million, served as a crucial liquidity and sentiment gauge for Stellar. As of April 2025, whale holdings stood at 51.79%, recovering from a mid-January low below 47.25%.
This rising trend suggested growing whale confidence. This preceded accumulation or speculative positioning phases in anticipation of upward momentum for XLM.
Similar past spikes above 52.00%, like the one in late January, were followed by brief market turbulence. This pattern suggested potential distribution phases during such periods.
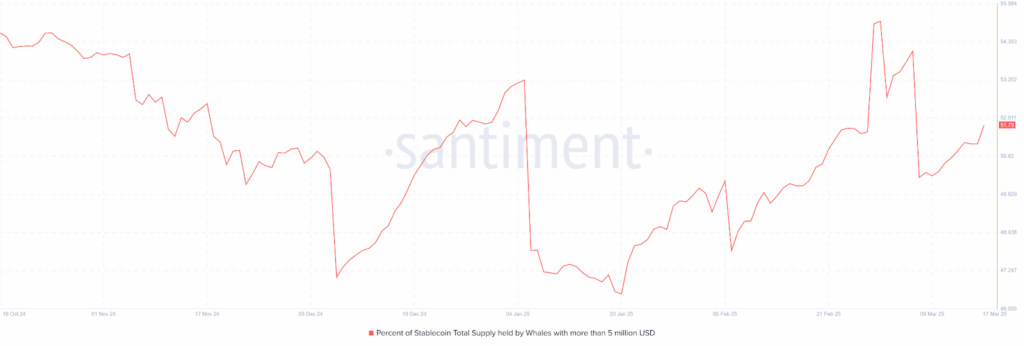
Therefore, the 51.79% reading hinted at bullish undercurrents for XLM price prediction. However, pushing beyond 52.01% might signal further strategic accumulation or trigger imminent profit-taking.
Conversely, if the metric dropped below 50.82%, it could indicate declining whale conviction. This could also weaken market structure and undermine price stability.
The long-term pattern reflected a V-shaped recovery from December’s low of approximately 46.05%, underscoring a shift in sentiment.
If the upward curve continued, it would likely support a bullish XLM price prediction. However, a reversal might lead to a fall toward the 48.43%–47.25% zone, suggesting a return to risk-off sentiment.
How Bitfinex Positioning Shaped Price Swing
Further, the Bitfinex margin positions chart from November 1, 2024, to April 10, 2025, revealed critical insights into Bitcoin’s price movements. It fluctuated between $0.04 and $0.65.
Initially, the margin long positions surged to 8000000XLM around mid-November 2024. This happened when the Bitcoin price climbed to $0.50, indicating strong bullish sentiment.
The short positions peaked at 12000000XLM on November 8, 2024. The price dipped to $0.4 at that time, reflecting bearish pressure.
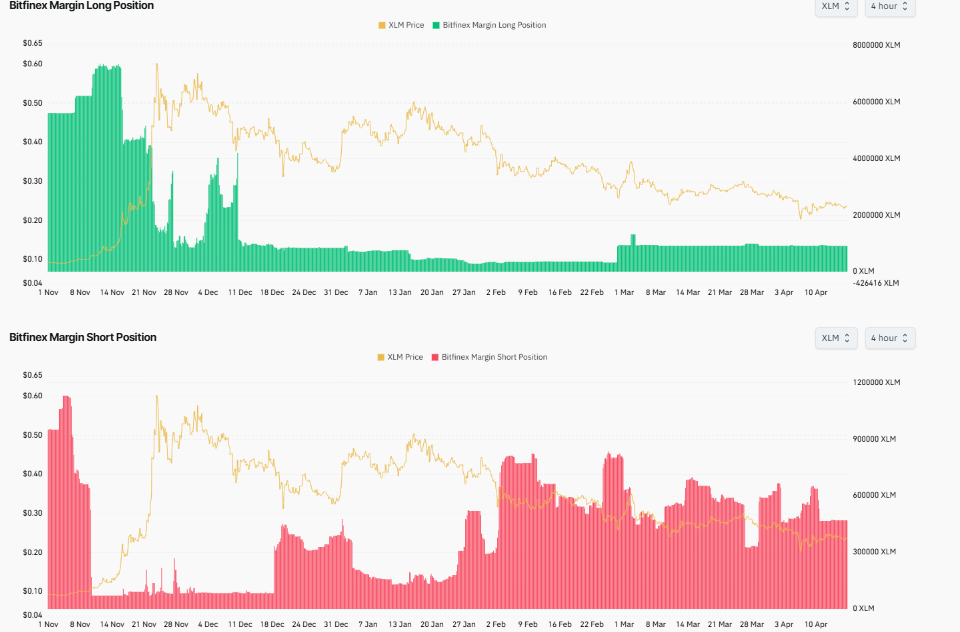
By December 24, 2024, longs dropped to $0.35 XLM, and the price fell further to $0.30. At the same time, shorts remained high at 9000000XLM, suggesting a potential reversal.
A pattern of declining longs persisted into February 2, 2025, with the price at $0.20. However, a brief spike in longs to 424416XLM by April 10, 2025, aligned with a price recovery to $0.25.
Going forward, if longs had increased above 8000000XLM, the price might have risen to $0.50. Conversely, if shorts had exceeded 12000000XLM, the XLM price prediction trend could see the token drop to $0.15.
These patterns and levels indicated a volatile market where both upward and downward shifts were possible.