

Key Insights:
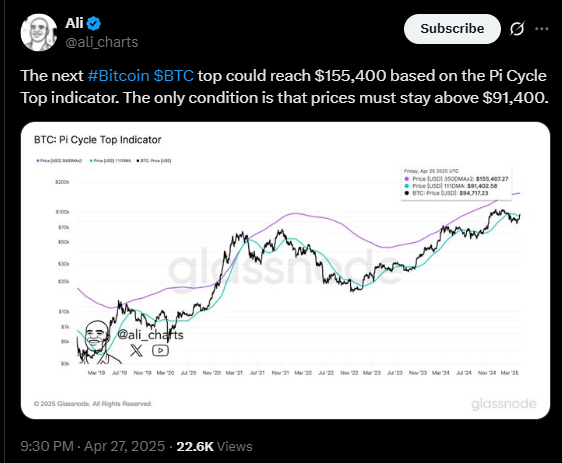
- Bitcoin prediction for the coming days appears bullish. Experts hint that BTC could hit the $155,400 level.
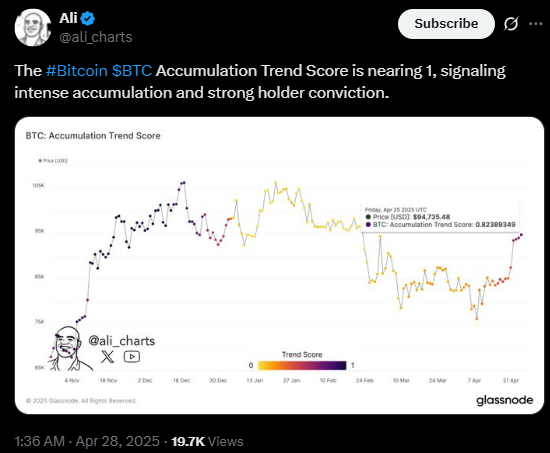
- Bitcoin accumulation trends score near 1, indicating intense accumulation by whales and long-term holders.
- Bitcoin Long/Short ratio is above 1, indicating strong bullish sentiment among traders.
Bitcoin (BTC), the dominant force in the cryptocurrency market, appears to be consolidating after a significant rally. On-chain data indicates that whales, institutions, and investors are heavily accumulating the asset at current levels.
Based on whale participation and on-chain metrics, the Bitcoin prediction appears strongly bullish for the upcoming days.
Bitcoin Could Reach $155,400, Says Expert
Recently, a prominent crypto expert shared a post on X, where he provided a Bitcoin prediction. In the post, the expert noted that Bitcoin could hit the $155,400 level, as indicated by the Pi Cycle Top Indicator. However, the key condition is that the price of BTC must hold above the $91,400 level.
Meanwhile, another post highlighted the Bitcoin accumulation trend score from Glassnode, which is near 1. The post stated that this indicator signals intense accumulation and reflects strong conviction among holders.
These posts on X appeared when Bitcoin has been consolidating in a narrow range for the past few days.
Bitcoin Price Action and Technical Analysis
According to expert technical analysis, the Bitcoin prediction appears bullish and is on the verge of a massive upside rally.
BTC has been trading within a narrow range of $92,700 to $95,700 over the past three days. The price is currently hovering near the upper boundary, signaling potential breakout or resistance testing.
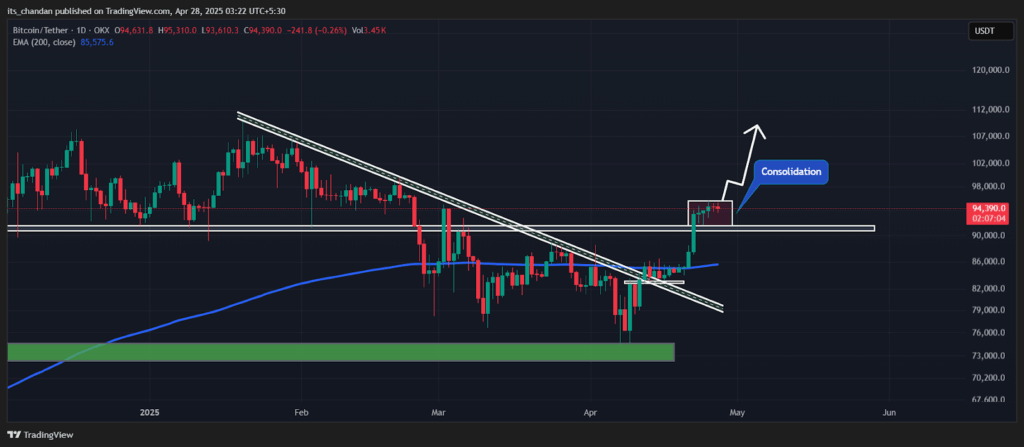
Bitcoin’s bullish potential hinges on breaking out of its consolidation range. A daily candle closing above $96,000 could confirm an upward trend and signal further gains.
If this happens, there is a strong possibility it could soar by 12% to reach the all-time high of $109,800 in the future. If Bitcoin breaks below $90,800, the Bitcoin prediction could turn bearish.
A daily candle closing under this level may signal a downward trend, potentially leading to further price declines. If this happens, BTC could drop by 6% until it reaches the next support at the $85,850 level.
At present, BTC is trading above the 200 EMA on the daily time frame, indicating that the asset is in an uptrend. Traders and investors rely on this indicator to assess market trends.
It helps them determine whether an asset is in an uptrend or downtrend, guiding their investment decisions accordingly.
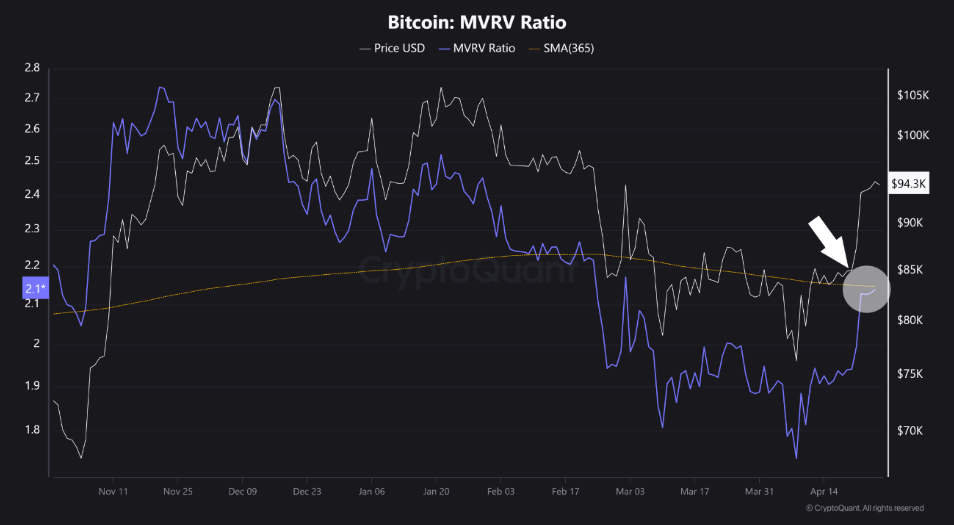
Experts’ Bullish View on BTC
Bitcoin’s MVRV ratio is approaching its 365-day Simple Moving Average (SMA), a key threshold for trend reversals. Analysts suggest that if BTC crosses this level, it could signal a shift in market direction.
As per the shared chart, it appears that Bitcoin has spent about 60 days below the SMA. If the MVRV ratio reaches near the 365 SMA, it raises the question of whether BTC is about to enter a bullish trend.
The expert noted that if BTC breaches this level successfully, it could signal a shift in sentiment toward the bullish side.
Recent data from Coinglass suggests that intraday traders are leaning bullish on Bitcoin. Their strong bets on the upside indicate growing confidence in BTC’s price movement, potentially fueling further gains.
Traders have been over-leveraged between $93,127 (support) and $94,951 (resistance) in the past 24 hours. During this period, they accumulated $453.26 million in long positions at the lower boundary.
Meanwhile, $341 million in short positions were built near the upper resistance level. This positioning highlights significant market activity and potential volatility ahead.
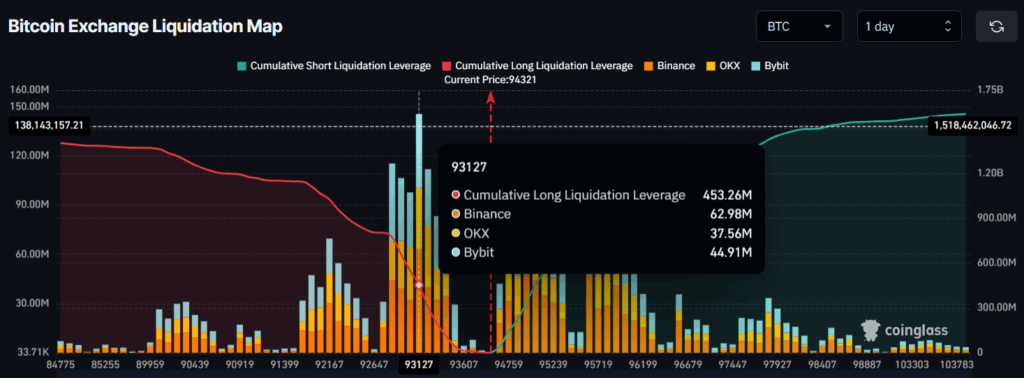
This metric reveals that the bulls are dominating the asset, believing that the BTC price won’t fall below the $93,127 level.