

Key Insights:
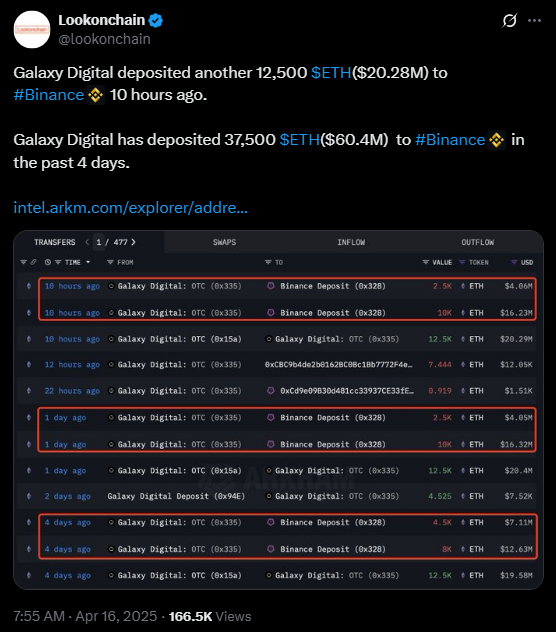
- Over the past 24 hours, Ethereum (ETH) whales have dumped 13,660 ETH worth $22.11 million.
- This massive sell-off by whales raises concerns about whether ETH will continue to face downward selling pressure.
- The daily chart revealed that ETH is at a make-or-break level, with hopes still alive for a move toward the $1,000 or $2,100 levels.
ETH price prediction has recently been a compelling topic for investors and traders. It held particular relevance for those navigating through ongoing consolidation.
Ethereum price has consolidated for over a week. Moving ahead, the token remained confined within a tight range of $1,470 to $1,690.
ETH Price Prediction: Sell-Off Intensifies Amid Market Consolidation
The ongoing consolidation appears to be diminishing interest from whales and investors. This decline has contributed to the significant sell-off observed in the market recently.

On April 16, 2025, blockchain-based transaction tracker Lookonchain made several posts on X about ETH sell-off activity. One of the posts revealed that whales and investors had dumped over 13,660 ETH worth $22.11 million.
The massive sell-off by industry giants may intensify selling pressure. This could lead to a further decline in price, influencing ETH price prediction trends.
At press time, ETH was trading near $1,550 and had registered a price decline of over 1.45% in the past 24 hours. However, its trading volume jumped by 20% during the same period. This indicated heightened participation from traders and investors.
An increase in trading volume during bearish market sentiment often signals a downturn. It indicated more sellers joining in a potential market dump.
Ethereum Technical Analysis and Key Levels
The asset is at a make-or-break level per expert technical analysis and their ETH price prediction. However, a consolidation breakout or breakdown could determine where the Ethereum price will head in the coming days.
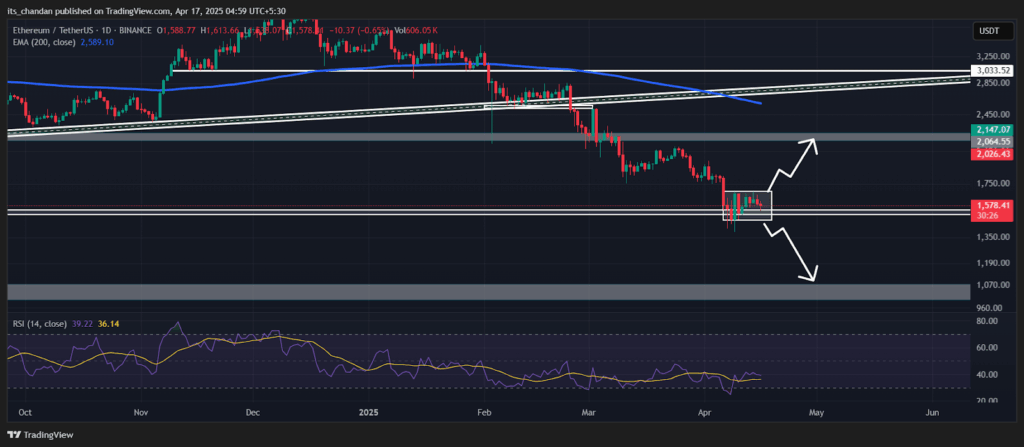
Recent price action and historical momentum suggested a bullish ETH price prediction. This could materialize if Ethereum breaks out of its current zone and closes a daily candle above $1,695.
If this happens, it could soar by 28%, with Ethereum potentially reaching the next resistance level at $2,165. However, the ETH price prediction could turn bearish if it falls below the consolidation zone.
If Ethereum closes a daily candle below the $1,450 level, it may experience a 27% drop. This decline could bring the price down to the next support level, nearly $1,080, in the coming days.
As of now, the ETH price has traded below the 200 Exponential Moving Average (EMA) on the daily time frame. This indicated that the asset is in a bearish trend with sellers dominating the market. The trend could only reverse if the asset’s price exceeds the 200 EMA.
Meanwhile, the Relative Strength Index (RSI) stood at 35, indicating that ETH price was in the oversold zone. It also suggested that the asset holds weak momentum, with investors losing confidence.
Bearish Dominance: Traders’ Bets and Its Impact on ETH Movement
Recent price action and ETH price prediction indicate a surge in traders’ interest and confidence on the bearish side. This trend has been highlighted by the on-chain analytics firm Coinglass.
The on-chain metrics indicate that traders are over-leveraged at the $1,574 support and $1,602 resistance levels. Long positions total $36.90 million, while short positions total $103.76 million.
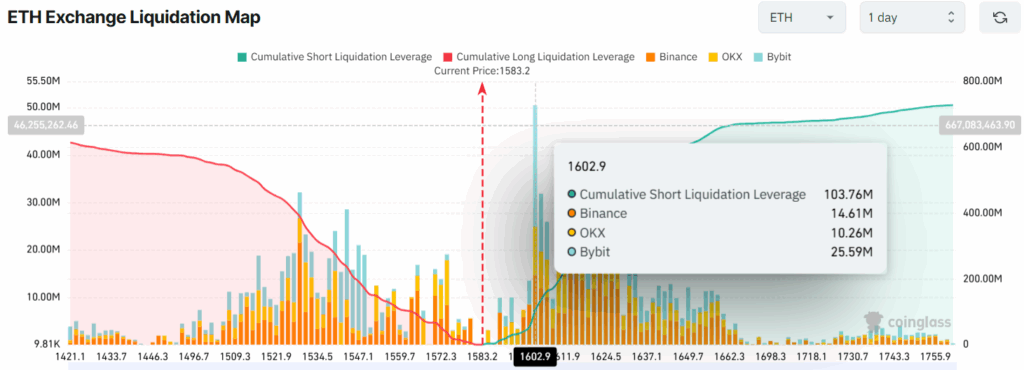
When examining the traders’ bets, it appears that short sellers have been dominating the asset. This could create a hurdle for any upside movement.