

Key Insights :
- Hedera (HBAR) price is on the verge of breaking out from a bullish price action pattern.
- HBAR price could soar by 45% if it closes a daily candle above the $0.184 mark.
- Intraday traders appear to be over-leveraged at $0.1696 on the lower side and $0.18 on the upper side.
Hedera is shifting from a prolonged bearish trend to a bullish one. HBAR price declined by nearly 70% during the recent market crash. However, it has recovered and is poised for a significant upside rally.
HBAR’s bullish momentum likely stems from its breakout from a descending channel. This pattern formed during the daily timeframe of the market crash, signaling a potential upward trend.
Meanwhile, significant assets like Bitcoin (BTC) and Ethereum (ETH) influence the overall market with their impressive price surges.
HBAR Price Action and Key Levels
Technical analysis suggests that the HBAR price is entering an intense bullish phase. Price predictions indicate a potential massive rally in the coming days.
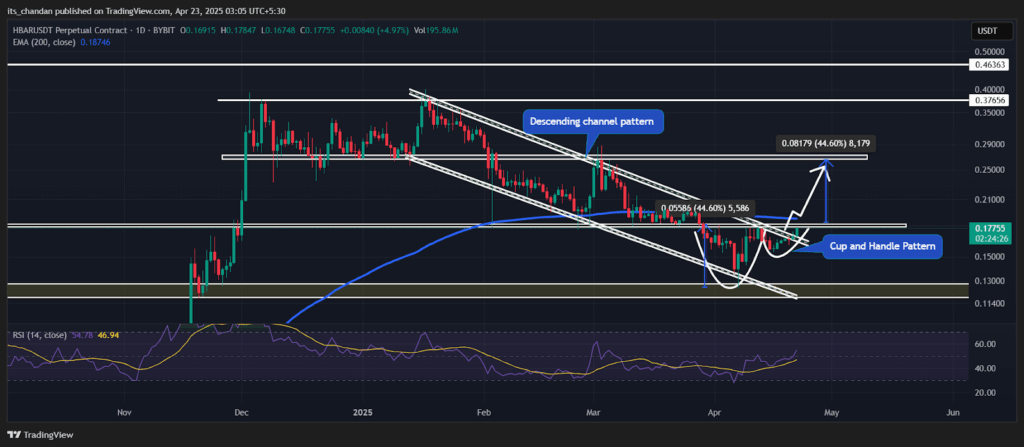
The daily chart showed that the asset has broken out of a descending channel. It has also formed a bullish cup and handle pattern. Now, it is nearing a potential breakout.
HBAR Price Prediction for the Coming Days
It could surge if HBAR breaks out of the cup and handle pattern. A daily close above $0.184 may trigger strong upward momentum. This could lead to a 45% rally toward the next resistance near $0.27.
However, this bullish thesis will only hold if the HBAR price closes a daily candle above the $0.184 mark. Otherwise, it may fail.
The asset has been trading below the 200-day EMA on the daily timeframe. This indicated that HBAR has been in a downtrend with weak momentum. However, the trend will only turn bullish if the HBAR price moves above the 200 EMA.
In addition to the 200 EMA, HBAR’s RSI stood at 55, indicating signs of growing bullish momentum. However, an RSI of 55 does not necessarily signal a buy. It only suggests an early sign of a potential trend shift.
At press time, HBAR price was trading near $0.1765, having registered a price surge of over 4.75% in the past 24 hours. However, during the same period, its trading volume dropped by 8%, indicating lower participation from traders and investors.
The drop in trading volume could stem from worries about a possible price decline. As the price nears the neckline of the bullish pattern, traders may be exercising caution.
Bullish Momentum Strengthens as Traders Lean Long
Traders are increasingly drawn to the asset amid its bullish price action and positive market sentiment. On-chain analytics firm Coinglass has reported a surge in interest, reflecting strong investor confidence.
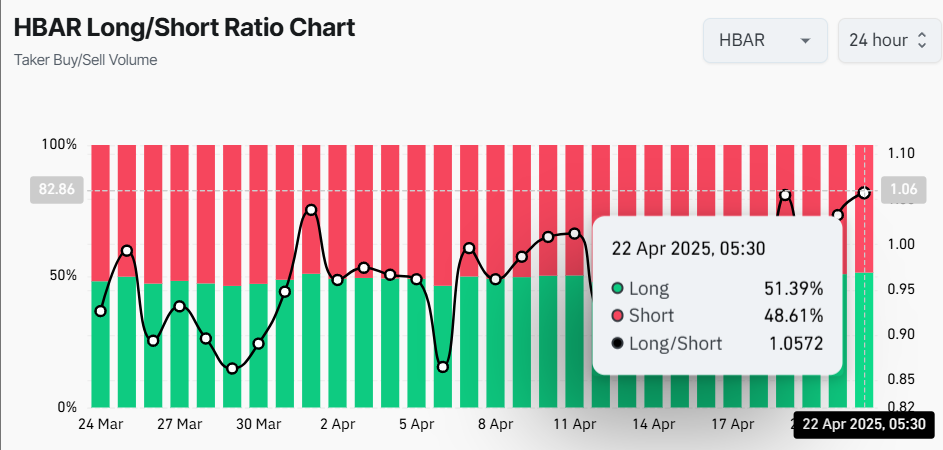
HBAR Long/Short ratio stood at 1.057, indicating strong bullish sentiment among traders. The metric showed that more traders are betting on the long side than the short side.
Data shows that traders were over-leveraged at $0.1696, acting as support. On the upper side, HBAR price faced resistance at $0.18 in the last 24 hours.
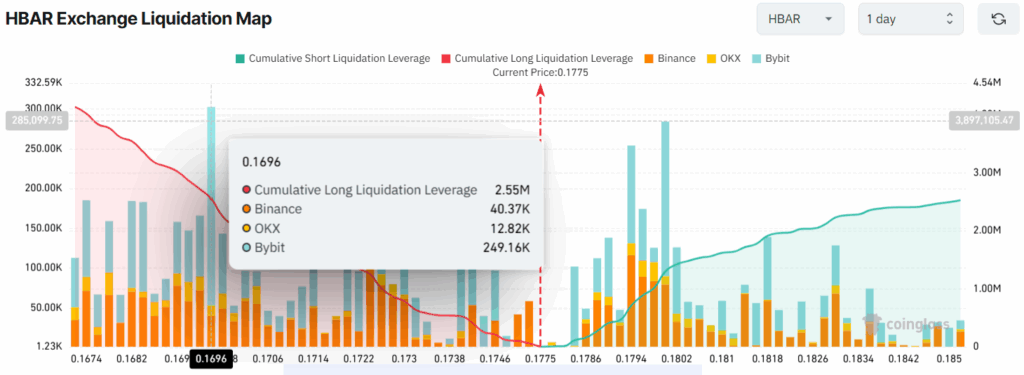
Traders have established $2.55 million in long positions and $1.30 million in short positions. This suggested bullish dominance in the asset, potentially driving its price higher soon.