

 sets a new all-time high in development contributor activity as social metrics and price structure indicate)
Key Insights:
- Internet Computer (ICP) developer contributors reached record levels on April 10, 2025.
- Social dominance places ICP atop all DePIN sector discussions.
- The price nears a breakout, and the long-standing descending resistance channel is being tested.
ICP Coin has recently reached a critical technological milestone. Chart patterns suggest that a significant trend reversal may be on the horizon. On-chain analytics published on Santiment indicate that ICP development activity on its codebase has reached a new high.
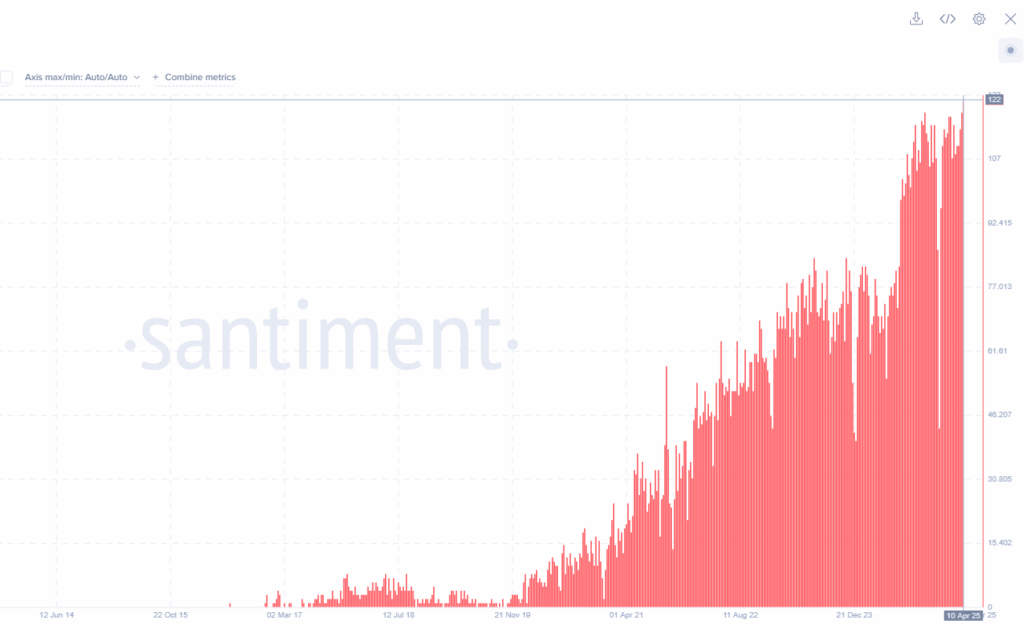
The number of active contributors has been steadily increasing since early 2023. This marks the highest milestone yet, with 122 contributors achieving unprecedented levels in the network’s history. Developer participation has consistently driven such remarkable growth.
This happened typically ahead of protocol-level advancements. This signified internal improvements or expanded integrations that might not yet be reflected in a token’s price.
ICP Coin Gains Traction Through Strong Social Metrics and DePIN Growth
Moreover, the allocation of ICPs toward development highlights its growing strength. The evolving social dynamics within the DePIN sector bolster this progress.
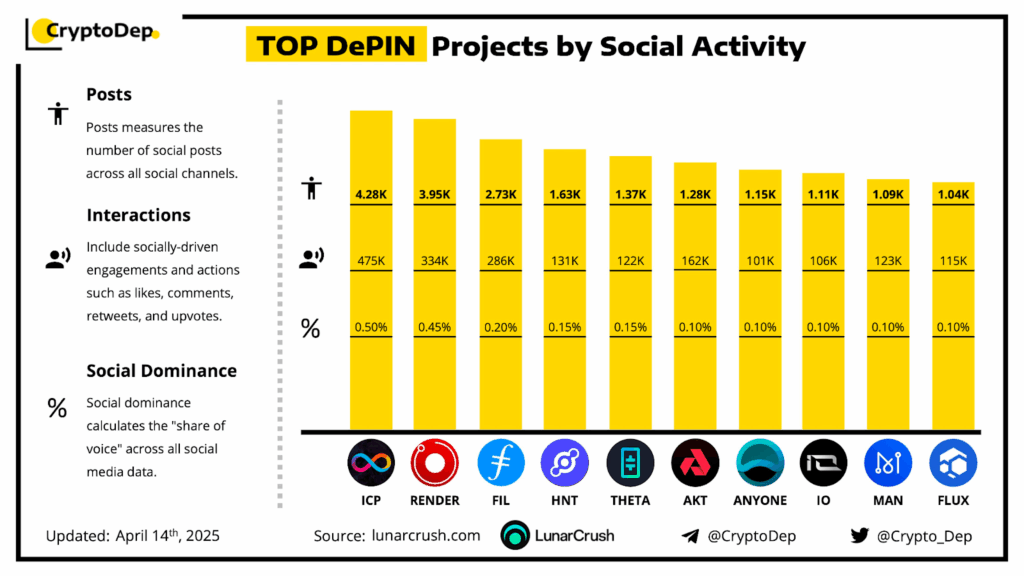
Though less popular, ICP leads across three key engagement metrics according to LunarCrush and CryptoDep reports. This project had gathered over 4.28K social media posts and 475K interactions such as likes, shares, retweets, and comments.
Additionally, Filecoin (2.73K posts, 0.20%) and Render (3.95K posts, 0.45%) were beaten out by ICP coin. It achieved a 0.50% share of voice across all crypto social channels.
As the broader crypto market stays down, the project’s high public participation suggests it can still garner attention. Social activity has a positive feedback effect of increasing visibility on exchanges and crypto data aggregators.
Due to this, more traders and developers may be drawn to the project. Also, all of these social momentum pressures confirm investor sentiment.
This creates a sense of anticipation for news, changes, or updates to the tokenomics. That could positively impact prices as more investors are drawn to the project.
Intraday Price Chart Shows Constructive Bullish Behaviour
A look at ICP’s real-time market data reveals the evolution of the price structure. CoinMarketCap showed that the token was trading at $4.94, up 2.34% intraday as of press time.
The daily trading volume rose to $54.17 million, up 8.37%, with a market capitalisation of $2.4 billion. A 2.25% volume-to-market-cap ratio for a mid-cap token means good liquidity.
ICP coin has recouped from a morning low of $4.82. After some consolidation, the price broke above the $4.83 resistance level, and that overhead resistance was the mid-term ceiling.
Since then, the trading action has become more upward, albeit less so, with less volatility in the afternoon. At the same time, overall control is with the buyer.
The late-day rally, however, did not feature a high-volume spike accompanying it. This implies that there was gradual accumulation rather than impulsive speculation. A short-term bullish bias is forming due to the consistently higher lows on the intraday chart.
Falling Wedge Shows a Potential Reversal for ICP Coin
From a technical perspective, the ICP moves can stay within a well-defined descending channel on the 1D Binance candlestick chart. Since January 2025, ICP coin has experienced persistent bearish trends.
It has repeatedly formed lower highs and lower lows throughout this period. Multiple rejections from the upper resistance trendline and downward pressure can be applied in this channel.

The second half of April, however, showed a possible breakout attempt. ICP coin is testing the upper boundary of this falling channel. A new trend may begin if the $5.00 close does not close decisively below its opening price, and volume expands.
This observation is further supported by the Awesome Oscillator (AO) histogram. The histogram is starting to print shorter red bars.
However, it remains in negative territory (-0.493), and some green bars are beginning to show. This indicated that bearish momentum is weakening and that a bullish crossover will soon form.
A breakout from the falling channel can pave the path for retesting resistance in the $5.60 to $6.00 area. On the flip side, a structure failure can lead to a pullback to support at $4.20 – $4.40.