

Key Insights:
- Pi Network faces volatility, but long-term growth potential remains promising.
- Analysts recommend holding Pi despite recent price dips and recoveries.
- Pi’s market depth and liquidity suggest a promising long-term outlook.
Pi Network ($PI) underwent extreme price movements the previous week. This has caused concerns. Experts advise long-term holders to maintain their investment positions.
They believe the token shows promising growth potential for the future. An eToro official suggests not selling their PI assets just yet.
Pi coin price maintained a value of $0.60 on April 5th, 2025. Before this, the token achieved nearly $0.70 in late March 2025.

Exchange market watchers observed two troubling developments. During this time, currencies fell below $0.58 before analysts maintained a positive outlook for future market value.
The suspicion exists that the Pi coin price will recover to $2.6. However, its market price remains near $0.60.
Technical Analysis of Pi Coin Price Movements
PI token has displayed significant price movements during the last few days. These are characterized by sudden dips followed by rapid price recoveries.
At press time, Pi coin price stood at $0.60 after its previous peak at approximately $0.70. The price previously remained enclosed by a descending channel, creating well-defined lower highs and lower lows.
Analysis showed bearish price trends for Pi, as noted through this pattern. The red-shaded portion in this chart establishes a clear visual presentation of negative market momentum.
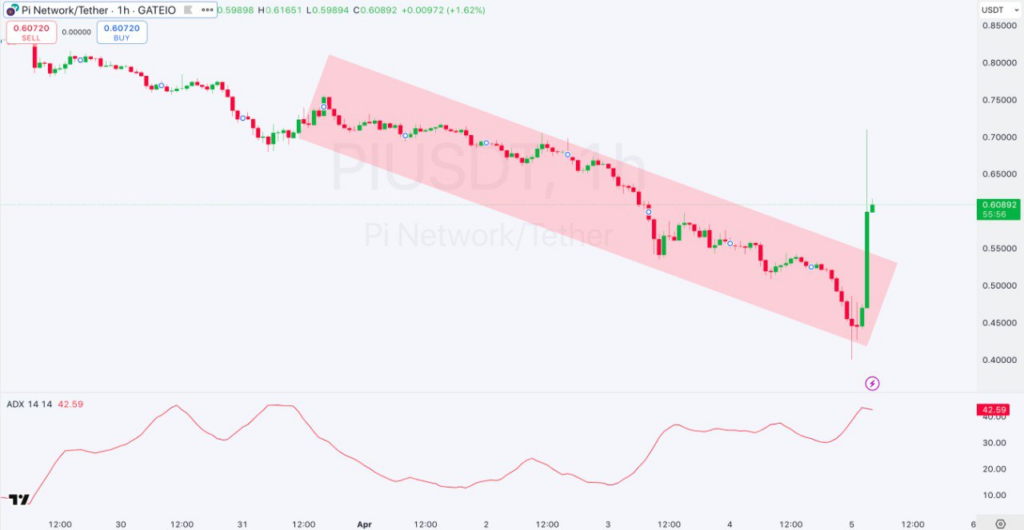
The hourly chart shows a steady price decline starting from $0.67. Since the start of this period, the price has faced multiple challenges to breaching the descending channel’s lower boundary. However, it failed to exceed it.
Market structures with this pattern indicate powerful resistance at the channel’s upper border. It shows that strong support takes place at the lower border.
The market experienced an abrupt price increase of up to $0.6 to break out of the descending channel. The bottom area displays the Average Directional Index (ADX), which currently shows a value of 42.59.
Trends receive their strength assessment through the ADX indicator. The market follows a strong trend whenever the ADX value exceeds 40. This implied that the present reversal remains active, according to this reading.
The fading bearish trend in the market is evident from the ADX. Pi coin price chart upswing matches the ADX curve. Traders currently hold different views despite the markets’ ongoing positive trend.
Pi Network Market Depth, Performance, and Sentiment
The current market value of Pi stood at $4.1 Billion. Also, the volatility showed a daily trading volume of $809.36 million. The market statistics indicate Pi has maintained decent market liquidity even though its value has declined recently.
Recent trading statistics reveal a 2.7% increase in investor participation in Pi over the past 24 hours. This surge is attributed to its current price level, which has drawn heightened interest.
The circulating tokens exceed 6.8 billion, while the total possible tokens reach 100 billion in the chart. The current price drop resulted from large sell orders surpassing smaller buy orders.
This caused a Pi coin price cascade throughout the previous few days. The eToro platform shows enduring support for Pi Network amongst its community. Over 88% of users have positive sentiments toward Pi Network on their sentiment page.
Public laudation for Pi maintains a stabilizing role when the cryptocurrency experiences momentary volatility. Current market sentiment does not seem sufficient to halt price reduction since sell orders continue to outpace buying interest.
This has caused rapid price swings in recent days. Market data from Pi’s trading exchanges indicates that an imbalance drove price drops.
A higher number of small buy orders than large sell orders contributed to this decline. According to market data, Pi’s short-term price volatility depends substantially on its level of liquidity.