

Key Insights:
- After a 50% price drop, Polkadot (DOT) has reached a crucial support area of $3.40, which will determine DOT’s next move.
- Polkadot price prediction appears bullish, as this level has a strong history of triggering price reversals.
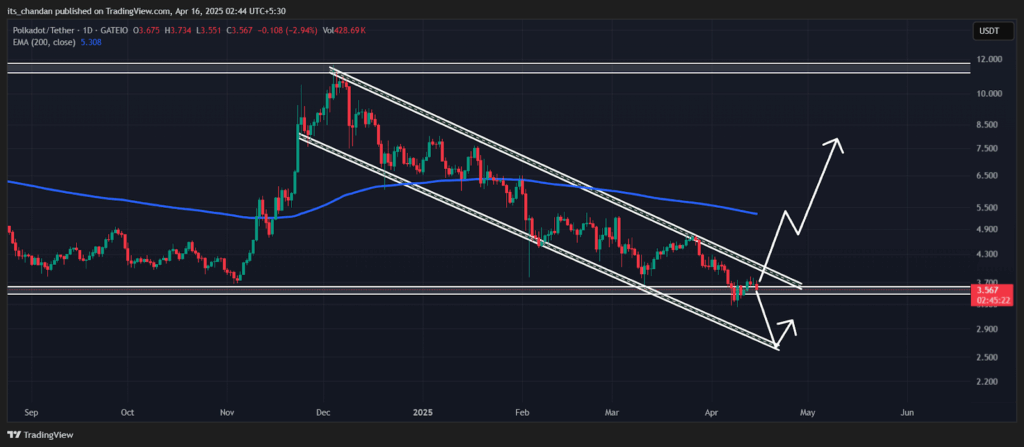
- DOT has been lingering in a descending channel pattern since November 2024. Now is the time when the pattern either breaks or the price falls.
Polkadot price prediction recently gained significance as it hit the key support level of $3.40. This development highlighted potential opportunities for market analysis.
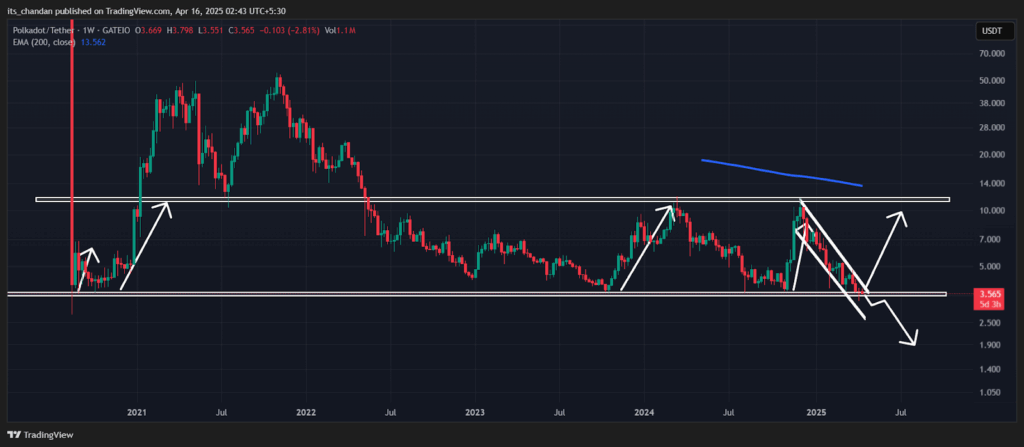
DOT price has revisited this significant historical level. Additionally, the asset has dropped to its lowest point in the past five years. The chart and historical price momentum revealed that DOT has reached this crucial support level for the fifth time.
Polkadot Price Prediction, Current Momentum & Technical Analysis
Historically, this level has served as robust support with significant buying pressure. Such trends have often triggered remarkable upside rallies.
Compared with historical price momentum, Polkadot price prediction appears bullish, suggesting that history may repeat itself. According to expert technical analysis and current market sentiment, DOT may struggle near this crucial level or go for an upside rally.
It remains challenging amid ongoing market uncertainty. The daily chart shows that since late November 2024, DOT has been trading within a descending channel.
This pattern is characterized by the formation of lower highs and lower lows. Amid the volatility in the asset’s price, DOT has finally formed its lower low and now appears to be heading for a lower high.
Polkadot Price Prediction for Bullish and Bearish Side
Considering historical trends and the Polkadot price prediction, DOT price will likely maintain the $3.40 support level. This stability might persist until a significant shift in market sentiment occurs.
If this occurs, DOT may break out of the descending channel pattern and witness an upside rally.
On the other hand, if this does not happen, the Polkadot price prediction turns bearish. Moving ahead, the price may experience a significant crash.
At press time, the DOT price was consolidating within a tight range close to a critical support level. This positioning marks a decisive moment for future price movements. The token was trading below the 200-day Exponential Moving Average (EMA) on the daily timeframe.
This indicated that the asset is in a downtrend with weak momentum. DOT has been hovering near $3.58 and has recorded a price decline of over 3.70% in the past 24 hours.
This notable drop, amid market uncertainty, raises concerns about whether the price will recover this time. As a result, the asset’s trading volume has dropped by 25%. This decline in volume may be contributing to DOT’s ongoing price consolidation.
Bullish On-Chain Metrics
An analysis of trader activity reveals a strong inclination toward long positions. Data from the on-chain analytics firm Coinglass supported this observation.
During the ongoing price consolidation, the DOT long/short ratio notably surged from 0.81 to 1.08. This indicated that trader sentiment has shifted from extremely bearish to bullish in just 12 hours.
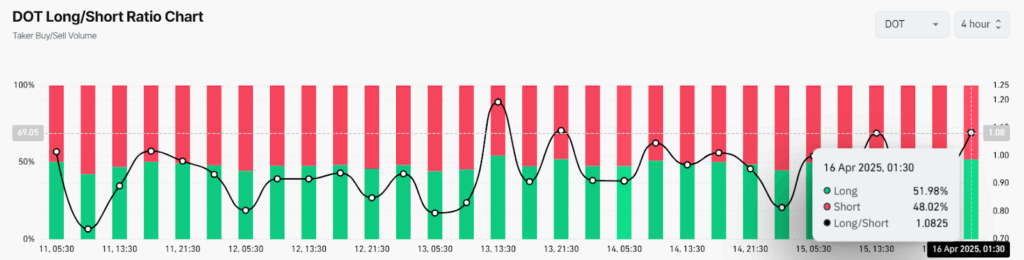
A ratio above 1 signaled strong bullish sentiment among traders, revealing that long positions outperform short ones. In addition to the notable long positions, at press time, traders were over-leveraged at $3.50 on the lower side (support).
There, they have built $3.00 million worth of long positions. At $3.73, DOT faced an over-leveraged resistance level. Traders have constructed $2.89 million in short positions at this upper price range.
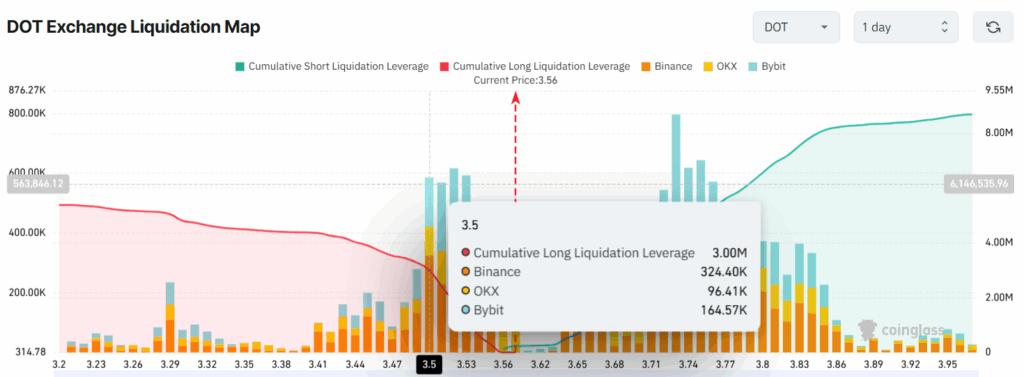
When combining these on-chain metrics, bulls are back to support DOT, while sellers or bears seem exhausted. If this momentum continues and the DOT price holds the $3.40 level, it could easily reclaim its recent value.