

Key Insights:
- Shiba Inu (SHIB) has formed a bullish price action pattern and is on the verge of a bullish breakout.
- The daily chart reveals that if market sentiment remains unchanged, the SHIB coin price could soar by 25%.
- Participation from whales and investors has significantly declined, resulting in a 53.90% drop in large transaction volume.
SHIB coin price seems to be moving away from its extended bearish phase. It now shows signs of transitioning into a bullish trend. Expert technical analysis, along with the current price action, signals that a massive upside rally is imminent.
SHIB Coin Price Faces Selling Pressure Amid Modest Price Surges
SHIB coin price was approximately $0.00001230 at press time. It showed a modest 0.95% increase over the last 24 hours. During the same period, its trading volume dropped by 20%. This indicated lower participation from traders and investors compared to previous days.
The potential reason behind the low trading volume appears to be SHIB’s current level. It has a history of facing strong selling pressure. This seems to be creating fear of a potential price decline, as history may repeat itself.
Shiba Inu Technical Analysis and Key Levels
According to expert technical analysis, SHIB has been in a downtrend for an extended period. However, it now appears to be breaking that bearish momentum.
The daily chart shows that the meme coin has been trading within a descending channel. It now appears poised for a potential breakout.
The chart indicates that the current SHIB coin price is at the upper boundary of the descending trendline. This level also serves as the neckline of an inverted head and shoulders pattern. SHIB has developed this pattern on its daily timeframe.
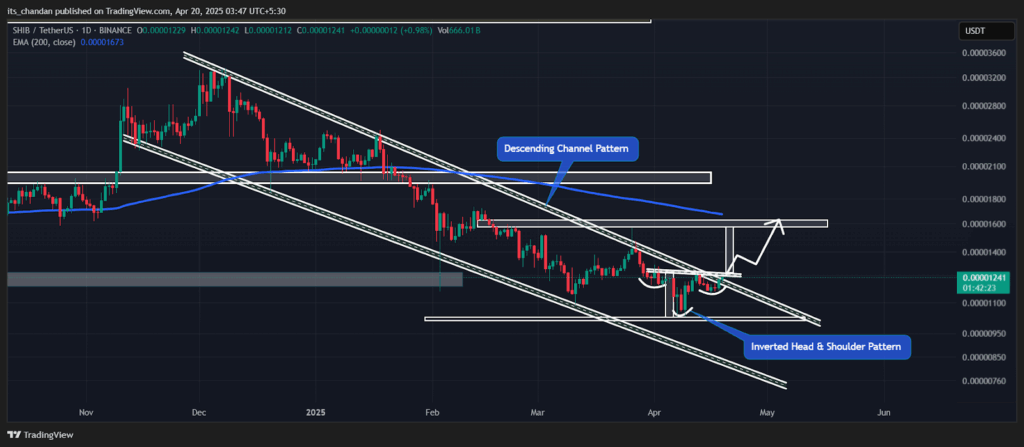
If the SHIB coin price breaks the descending trendline, it must close a daily candle above $0.00001283. Achieving this could trigger a 25% price surge. The next resistance level is anticipated at $0.00001622.
On the other hand, if sentiment shifts and the SHIB coin price fails to breach the channel pattern, history might repeat itself. The meme coin could experience a 20% price decline, potentially dropping to the $0.00001020 mark.
SHIB price has been trading below the 200-day EMA on the daily timeframe. This indicated that the asset remains in a downtrend.
SHIB’s Large Transaction Volume Drops by 54%
Besides all this, participation from whales and investors appears to be declining, potentially due to current market sentiment and price action. Data from IntoTheBlock reveals that large transaction volume has dropped by 53.90% over the past 24 hours.
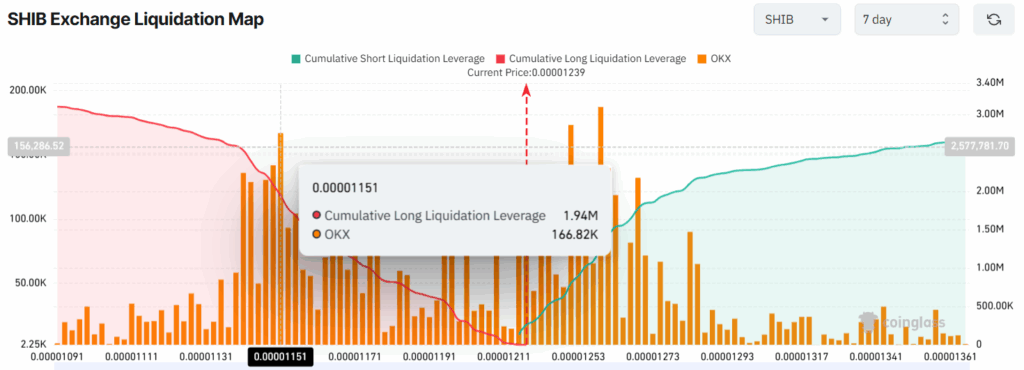
Coinglass reported reduced whale activity but highlighted strong bullish interest among traders. This indicates growing optimism despite limited whale participation.
Traders have been significantly over-leveraged within the range of $0.00001151 (support) and $0.00001259 (resistance). Over the past week, this has resulted in $1.94 million in long positions and $1.28 million in short positions.
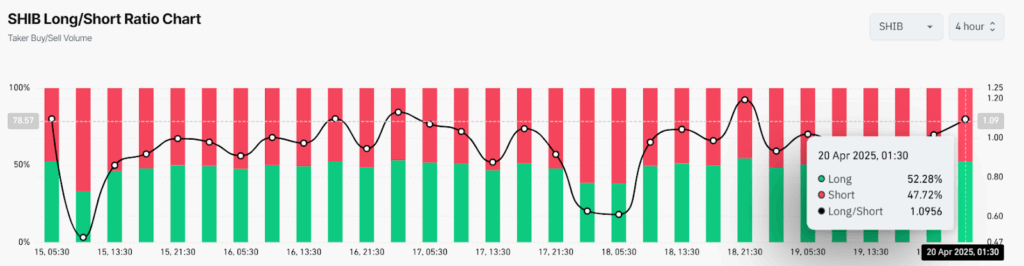
Today, the SHIB long/short ratio stood at 1.09, indicating strong bullish sentiment among traders. This metric further shows that traders are betting more on the long than the short.
According to the data, 52.28% of top traders hold long positions. On the other hand, 47.72% hold short positions.
The integration of on-chain metrics and technical analysis indicates strong bullish dominance over the asset. This momentum might assist the meme coin in overcoming its extended resistance level.