

Key Insights:
- SHIB burn rate surged over 1500%, reducing circulating supply and signaling renewed investor attention.
- SHIB’s RSI at 54.10 showed moderate bullish momentum with room for further upside.
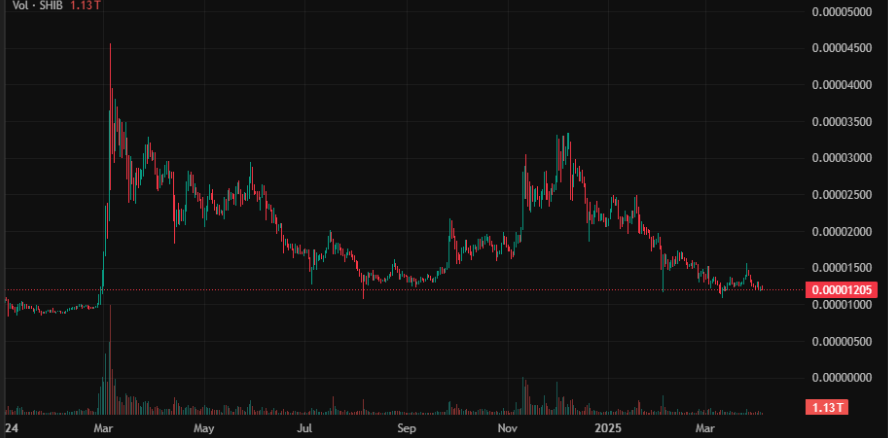
- The trading volume jumped 20.92% to $330M, indicating rising market activity and potential price movement.
Shiba Inu ($SHIB) is again capturing attention after its burn rate jumped over 1500% within 24 hours. The SHIB trading volume has surged, even with its current price at $0.00001199.
This increase fuels speculation among investors about significant Shiba Inu price movements ahead. Technical signals indicated bullish trends. At the same time, increased trading activity requires traders to watch the token’s future market performance closely.
SHIB Burn Rate Surge: Impact on Shiba Inu Price & Market Dynamics
Shiba Inu’s burn rate has spiked by over 1500%, based on data from Shibburn, removing millions of tokens from circulation. The recent market demand surge has shifted attention toward evaluating the impact of supply reduction.
Analysts are exploring whether this could lead to a rise in the Shiba Inu price during this period. Small amounts of burned tokens remain insignificant compared to the total supply. However, its sustained burn activities might shape market conditions within extended periods.
The current circulating supply of SHIB totaled approximately 589.25 trillion from its maximum of 589.5 trillion. One challenge to fast price growth stems from the massive supply distribution.
Yet, rising burn activity may result in long-term market pressure. The project’s deflationary approach demands lasting token burns, and numerous community members advocate for such activities.
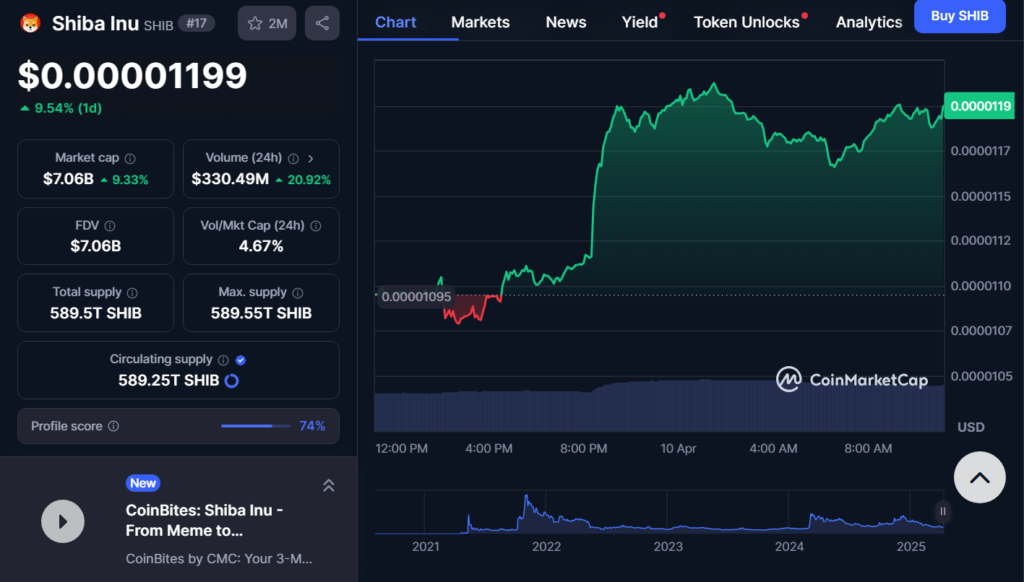
SHIB increased its burn rate while its value rose by almost 10% during the last 24 hours. The buying activity increased noticeably as the trading volume surged by 20.92% to $330.49 Million.
SHIB’s market capitalization reached $7.06 Billion. The growing market volume and price levels have caught analysts’ attention. They observe whether these factors might lead to a short rally or resistance.
Technical Setup Suggests Possible Breakout
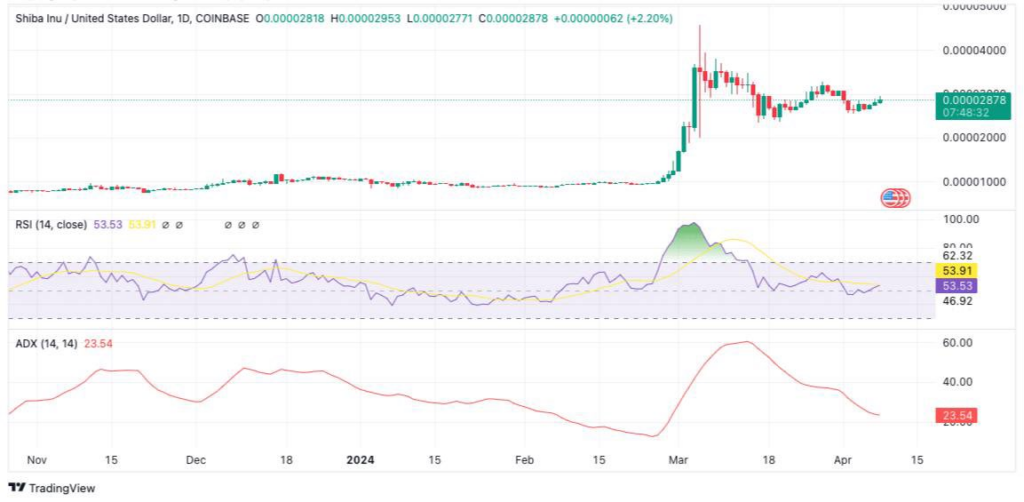
Shiba Inu price chart against USDT has shown early signs of a possible trend reversal after a prolonged 75-week downtrend. Throughout this phase, token prices kept falling low while sellers exerted persistent force on the market.
The price has experienced a breakout, triggering new higher lows. This suggested the possibility of forming a new bullish structure. The modification in the price pattern has attracted market watchers who analyze it for validation.
SHIB maintains its position above the significant support area at $0.00001100. The resistance levels exist at $0.00001250 before reaching $0.00001300.
Price increases could occur if the market clears existing support points at $0.00001100, $0.00001250, and $0.00001300. The breakout zone may be a foundation for upward movement, mainly if supported by rising volume.
The Relative Strength Index (RSI) was currently at 54.10. This suggested moderate bullish momentum without being overbought.
Bollinger Bands were also tightening. This usually signals reduced volatility and often precedes a larger price movement. The market observers track these indications to verify the continuity of price appreciation.
Market Sentiment and Future Outlook
The funding rate for SHIB has remained close to zero over the past few weeks, reflecting neutral sentiment in the market. Price predictions involving long positions increased their activity in December and January, resulting in favorable funding rates.
The rate showed that many traders picked price elevation bets now. The decrease in Shiba Inu price between February and March triggered short positions, which turned funding rates negative.
Market participants became more bearish because of this shift in trading patterns during that period. The funding rate was fixed to zero at the beginning of April.
This implied balanced activity between traders who bought and sold. The market usually demonstrated this position before one of its major directional movements.
Analysts have shown consistently favorable funding rates rely on rising prices and increased trading volume. These factors are essential for developing bullish momentum.
At press time, Shiba Inu price was trading at $0.00001205, just above the support level of $0.00001100. Market volatility continues due to its extensive supply and historical price movements, even during recent purchase agreements.