

Key Insights:
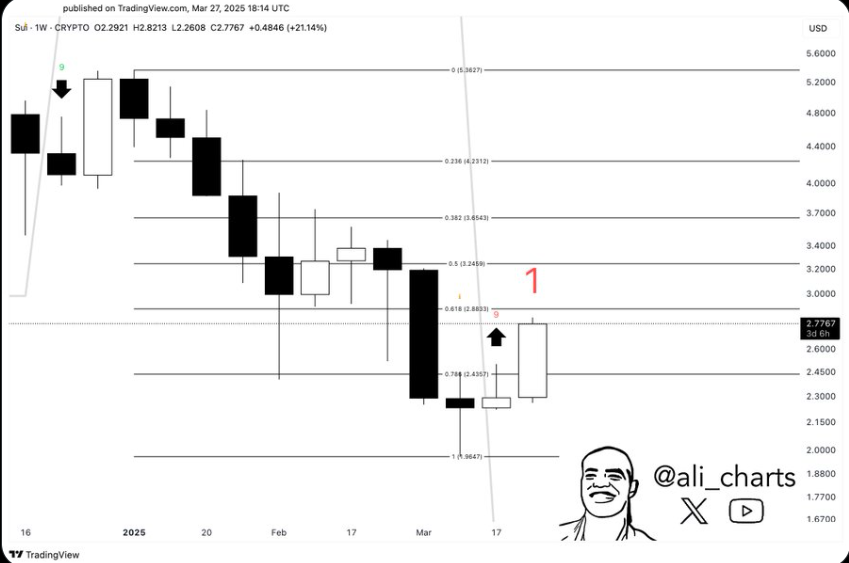
- A TD Sequential buy signal on the weekly chart propelled SUI to a 25% price increase.
- The MACD has crossed bullish, and the BBP is at 0.4090, indicating increasing upward momentum.
- Over the past week, SUI climbed 14.16%, reaching $2.80 before retracting slightly to $2.59.
SUI crypto price has demonstrated bullish indications through multiple technical indicators showing potential future increases.
According to market analysts, the crypto has a potential breakthrough toward $3 soon because multiple key momentum patterns and indicators show positive alignment.
SUI Crypto Price Buy Signal on TD Sequential
SUI crypto price recent increase has been significantly influenced by the TD Sequential buy signal that formed on the weekly chart.
The indicator which identifies trend reversal signals generated a buy signal when market conditions stabilized at that time.
Crypto analyst Ali Martinez noted that the crypto’s price increased by 25% following its upward momentum as investors demonstrated greater willingness to buy and this modified their market outlook.
The TD Sequential indicator has received widespread approval from traders because it detects substantial price movement shifts.
The buy signal suggests SUI has hit its bottom valuation thus indicating potential price appreciation toward higher levels.
The market signal has prompted traders to open positions thus causing substantial price changes throughout the past week.
Another analyst, DevKhabib has suggested that SUI might be performing a retest before potentially launching into an upward trend.
SUI recently retreated after striking resistance at $2.80 while DevKhabib emphasizes the trendline as an essential support threshold.
The price retaining position above this level may fuel a rebound which could target increased resistance positions.

MACD and BBP Indicate Bullish Momentum
Meanwhile, the recent bullish cross of the MACD indicator enhances the optimistic outlook for SUI in combination with multiple positive signals.
The MACD line currently stands above its signal line and this pattern generally indicates that upward market momentum could likely strengthen.
This technical indicator creates conditions for longer price ascents because its appearance indicates forthcoming upward market force over the near future.

Additionally, the Bull Bear Power (BBP) indicator has displayed a strong positive sentiment with a value of 0.4090.
The positive BBP reading shows buying pressure surpasses selling pressure thus indicating SUI is likely to continue its upward trajectory..
SUI Crypto Price Action Over the Past Week
More so, SUI crypto price experienced a significant 14.16% price growth throughout the past week when it rose from $2.28 to its weekly apex of $2.80.
The increasing market value has piqued interest from retail and institutional traders who see this positive movement as an initial signal of long-term potential.
Market participants closely observe SUI to assess its continued bullish momentum after it reached its recent high at $2.80 which acts as a significant resistance point.
SUI reached its peak after which the token pulled back but stabilized at $2.59. A slight market pullback occurred but the price action continues to point upwards since actual support zones remain intact.
Market participants monitor the price closely as they wait for potential breakouts that could push SUI toward the $3 resistance threshold which traders regard as an essential asset benchmark.