

Key Insights:
- SUI displayed robust recovery potential at the price level of $1.75.
- Data comparisons showed NEAR has historically recovered from such performance levels.
- The market demonstrates resistance as SUI must respond with its most crucial move.
Sui price recently dropped to $1.75 before rising to $2.06. This fueled discussion about its possibility to regain its high of $5.3.
The token reached its previous peak value of approximately $5.3 before undergoing severe price decreases. SUI produced three successive lower lows similar to what NEAR experienced during 2021.
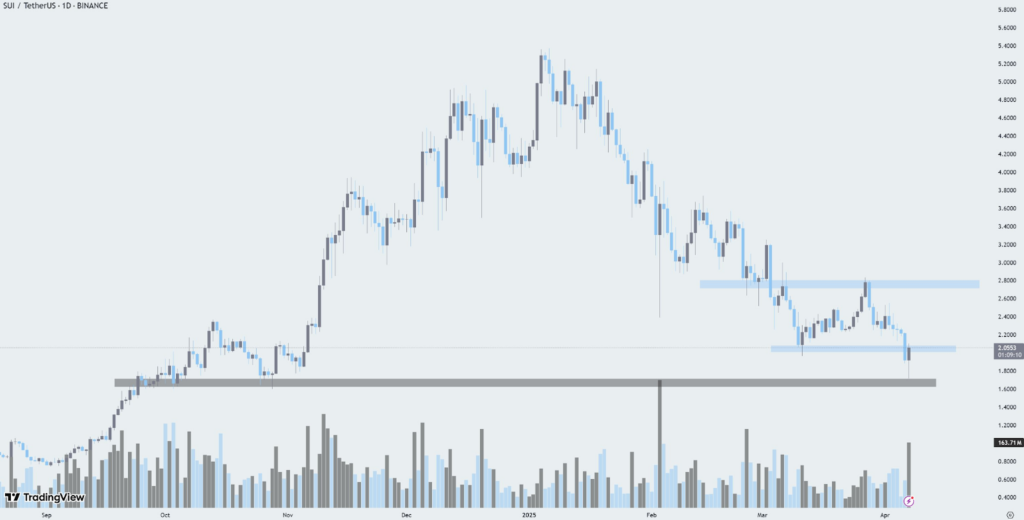
Sui price movements revealed critical support and resistance levels for maintaining price management. The token sank below its $1.955 threshold and reached $1.75 before rising above $2.06.
Strong market participation became visible through rising volumes when SUI prices decreased. This provided a potential foundation for additional price recovery.
In-Depth Technical Analysis of Sui Price Charts
One-day charts revealed the evolution of Sui price over several months. The token experienced a sharp growth rate from its initial value. It climbed to an estimated level of $5.3 during this period.
After this, SUI showed a correction phase, leading to its swift price decrease. The market lost its ability to support ongoing upward momentum. This is because a price drop started immediately after the peak.
During this period, the market witnessed substantial selling activity. Corresponding volume levels exceeded previous observations.
During this period of economic contraction, the substantial increase in market trades indicates that sellers maintained aggressive selling pressure. Due to this, selling demand exceeded the purchasing demand.
The price stabilization coincided with diminished trading volume, signifying a decrease in selloffs. This marked an accumulation period where market participants waited for the following substantial movement.
Comparison of SUI and NEAR Price Trends and Recovery Projections
SUI and NEAR price trends initially show rapid upward movements. Both charts later display sharp value reversals during their respective periods. Sui price correction consisted of three decreasing price bars in a row, matching the 2021 price trend of NEAR.
Market behavior data showed that SUI and NEAR might develop similar price patterns that usually involve robust growth. They typically lead to dramatic drops during their initial blockchain asset stages.
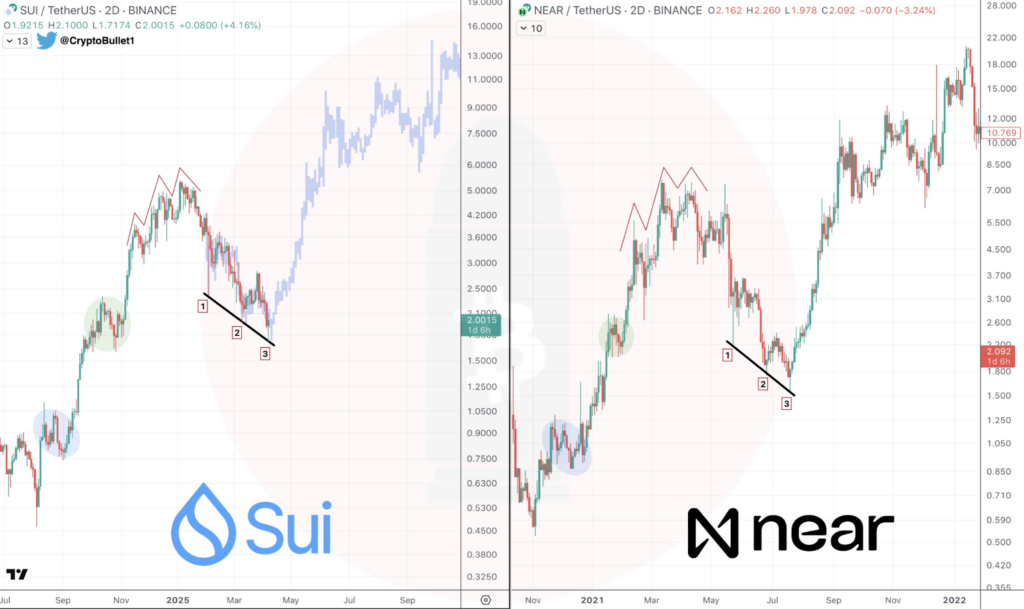
SUI and NEAR are classified among similar cryptos due to their ecosystems, making a chart comparison of both viable. If Sui price breaks through its resistance levels, it may follow a price recovery pattern akin to NEAR.
This could occur after SUI sustains its initial bullish recovery cycle. The analysis between these assets serves as a recovery projection for SUI. However, it also warns that market circumstances might produce different outcomes than NEAR has experienced.
Sui Price Movements: Resistance Levels & Market Sentiment Shift
Looking back at daily charts, we can see various support and resistance points for SUI. The support price at $1.80 represented a major resistance factor.
This is due to the fact that it served as a recovery area. SUI’s ability to hold its support position indicates that the price might become established at current levels before moving upward.
SUI’s primary resistance price was set at $2.06. A secondary resistance level was identified at $3.19. Sui price needs to surpass existing resistance points currently at $2.06 and extending toward $3.19. Those areas showed previous selling pressure during its previous price movements.
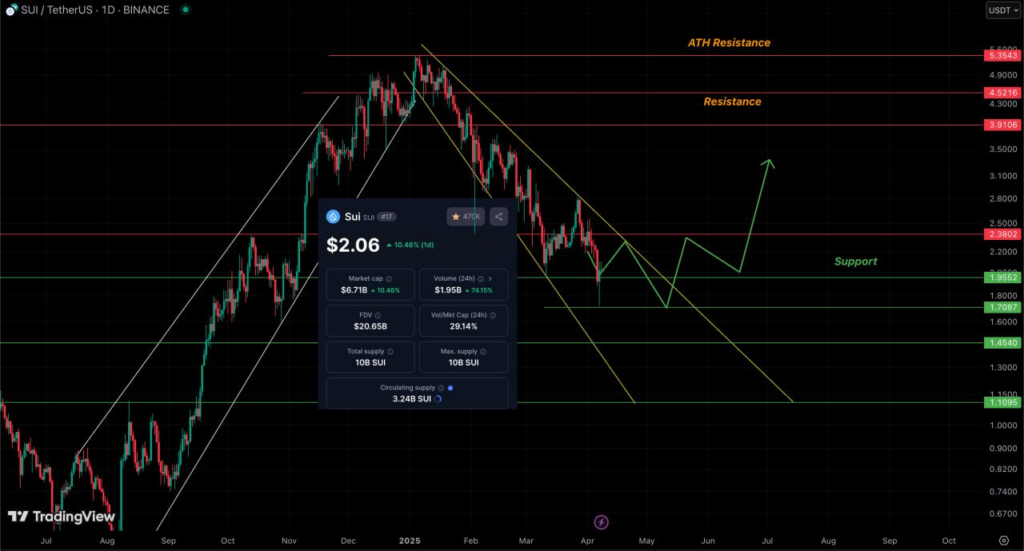
The charts also show trend lines tracking major price changes which occurred throughout the price decrease cycle. Whenever traders break through the descending trendline they face resistance during market movements.
This demonstrated a switch in market sentiment shifting from bear to bull. SUI may demonstrate potential for additional price increases.
However, this depends on if it manages to break through these resistance points. A break past the points could propel it to its previous high at $5.3.
Disclaimer
This article is for informational purposes only and provides no financial, investment, or other advice. The author or any people mentioned in this article are not responsible for any financial loss that may occur from investing in or trading. Please do your research before making any financial decisions.