

Key Insights:
- Whales have offloaded more than 20,000 Bitcoin $BTC.
- Bitcoin consolidation at $86K
- Bitcoin develops bullish trends in the market
Bitcoin whales conducted a large-scale withdrawal of more than 20,000 BTC, which indicates a significant profit-extraction activity. The market situation at $86,000 shows increasing uncertainty as Bitcoin holders withdrew over 20,000 BTC from their wallets.
The price of Bitcoin heavily relies on how whales in the market behave with their funds. According to recent data from Santiment, Bitcoin price volatility increases as large wallet owners known as “whales” decrease their Bitcoin holdings. Massive sell-offs from investors typically lead the market into price correction events or extensive periods of stagnation.
Bitcoin Prices Struggle to Gain
CoinMarketCap data shows that Bitcoin (BTC) was priced at $87,819 as of press time, a drop of 0.48% over the past day. The price movement was volatile, fluctuating between $86,500 and $88,200. The price then moved upwards positively at first, going up to around $88,300 and turning and pulling back the price sharply below $87,800. Overall, this is a mild downtrend, with price action forming lower highs and lows.
The slight 24-hour change in the price hints at a general caution among market investors. While Bitcoin has pulled back, the digital currency still maintains its stance above key support levels and above $87,000.
Bitcoin Price Consolidation at $86K
Bitcoin remains close to $86,000 while it tries to build solid support structures during ongoing market selling. The daily BTC/USD chart on Binance analyzes Bitcoin’s exit from the descending trend channel. The breakout points toward changing market momentum. Still, $88,000 is an essential barrier to additional price growth.
Technical chart patterns on Bitcoin show a potent combination of downward market forces and indications of an upcoming price change. For several weeks, BTC/USD has maintained positions within an ongoing descending channel on the daily Binance chart, which is shown in the shaded red area. The market entered a correction phase after the powerful upward movement that began in late 2024.
The price movement shows a downtrend pattern through consecutive lower highs and lower lows, which indicates a bearish channel formation. Recent price movements show positive signs because Bitcoin crossed above the highest border of its descending channel.
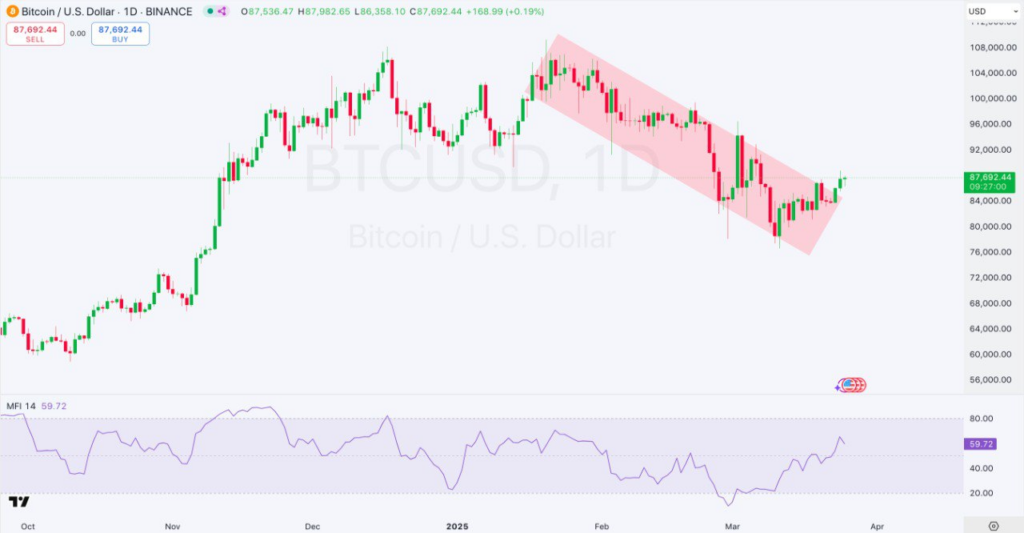
The Bitcoin price chart displays characteristics of standard bull-market corrections rather than an extensive downtrend activity in recent months. Continued buying trends within the market could push BTC above $90,000 before another attempt at hitting peak price values. Price will retract from the breakout level to $84,000 or reach $80,000 before prices resume their upward rise. The trend shows bullish attributes through strengthening indicators.
The Money Flow Index stands at 59.72 as it moves toward the overbought zone but continues to allow potential price growth. The market sentiment suggests rising buying pressure, which validates a trend transformation. The price shows adequate support at the $84,000 level, corresponding with major previous demand consolidation areas. A daily close higher than $88,000 will officially validate the breakthrough while creating conditions for Bitcoin to revisit the $92,000-$95,000 resistance.